
Introduction
In the previous article, I described how the SU carburettor measured the volume of air flowing into the engine and mixed this with a metered volume of finely atomised petrol droplets to give a precise Air to Fuel Ratio (AFR). Investigating how modern petrol affects the operation of the SU carburettor was one of the objectives of the Manchester XPAG tests, specifically to determine the optimum needle profile to use with modern fuels. It was this data that confirmed two of the predicted problems caused by modern fuel.
Air Fuel Ratio and Lambda
With non-ethanol blended petrol, the theoretical Air-to-Fuel Ratio (AFR) is 14.7:1 i.e. at a ratio of 14.7 gm of air for every gram of petrol, all the oxygen in the air will be used by burning hydrogen atoms to produce water (H20) and by burning carbon atoms to produce carbon dioxide (CO2). This ratio is referred to as the stoichiometric mixture. However, cars normally run with an AFR of between 12.5:1 and 13.5:1, i.e. with a mixture that is richer than the ideal. This is because some of the carbon burns to form carbon monoxide (CO) using only one oxygen atom rather than the two, hence the need for more petrol.
Normally the term LAMBDA is used rather than AFR. This is the ratio of the AFR an engine is producing divided by the theoretical ideal. Numbers less than 1 correspond to a rich mixture and greater than 1 a weak mixture. Maximum power is produced with a Lambda of 0.95 or a slightly rich mixture.
Modern cars are fitted with lambda sensors, which work by measuring the levels of oxygen in the exhaust, enabling the fuel injection system to be continually adjusted as the engine is running. A similar lambda sensor was fitted to the test engine at Manchester and used to ensure the mixture was set at a lambda of 0.95 for every test by manually tuning the carburettors.
Standard needle profile
The height of the suction piston in the carburettor is a direct measure of the volume of air flowing into the engine and reflects both the throttle setting and engine rpm. The annulus between the tapered needle and the jet, at that height, determines the volume of fuel leaving the jet and hence the AFR. As more air flows through the carburettor the height of the suction piston increases, pulling the tapered needle out of the jet, increasing the size of the annulus, allowing more petrol to leave the jet. The profile of the tapered needle sets the AFR for the different piston heights.
Simplistically, the suction piston will float at the same height when the engine is running at 4000 rpm on half throttle and at 2000rpm on full throttle. In both cases, the position of the needle in the jet will be the same and so the carburettor will deliver the same AFR.
Needle profiles are identified by two or three letters. There is a reference booklet “SU Carburettor Needle Profile Charts” available from Burlen Fuel Systems that lists all the needles and their profiles.

The profile of a needle is defined by its diameter at 1/8” steps down from the shoulder. The standard needle for the twin 1¼” SU carburettors fitted to the TB, TC and TD is an ES needle and its measurements are shown in the diagram.
This also shows the approximate range of positions on the needle when running at quarter (Q), half (H) and full throttle (F) up to 3750 rpm.
It is interesting to see the maximum piston height is only around 0.6” at 3750 rpm, full throttle and that normal road driving typically uses only the first 5 or 6 positions.
Measurements at Manchester

To determine the optimum needle profile, a set of tests were run using different fuels, engine revs and throttle settings. For every test run, i.e. one fuel, one engine RPM and with one throttle setting, the carburettors were set to deliver a Lambda of 0.95 using jet adjusting nuts and the ignition timing was set to give maximum power. In other words, the engine was fully re-tuned for every test run.
An indicator and a scale were fitted to the top of the suction chamber of each carburettor and the faces of the Jet adjusting nut were engraved with 1 – 6 dots to determine how many flats it had been screwed down. The combination of these two measurements give the position on the needle, allowing the diameter of the needle necessary to deliver a lambda of 0.95 to be calculated.
Running Lambda
The graph below shows an ideal plot of how Lambda would be expected to vary with carburettor piston height. Each dot represents an engine RPM / throttle setting that corresponds to that piston height. The white horizontal band is the ideal range for Lambda. Lambda values greater than 0.98 represent a weak mixture and less than 0.83 a rich mixture.

At light throttle / low revs the mixture is set rich (left hand side of the graph) to give a steady tick over and smooth slow running. It is set slightly rich at part throttle, normal running conditions, becoming richer at high revs / full throttle as the unburned fuel, helps protect the engine by cooling the valves.
Even though Lambda was set to 0.95 for each test at Manchester, it is possible to calculate what Lambda would have been delivered if the engine had not been re-tuned. The graph below shows this data with the jet adjusting nuts set at 4 flats down from fully closed, running with a standard ES needle and using the same brand of 95 octane petrol.

The first thing to notice is this graph looks very different from the ideal above. It shows two surprising features that go a long way to explaining the problems people experience when using modern fuel, weak running and slow combustion. However, despite these anomalies, overall, the data shows that the ES profile needle is a good choice for the XPAG engine.
Weak running
The five points circled in red (two green, quarter throttle and three red, half throttle), correspond to the carburettors delivering an exceptionally weak mixture. Indeed, had the carburettors not been re-tuned, the engine would not have started. Significantly, these 5 tests were run after the engine had been stopped for a few minutes to make adjustments.
These results clearly illustrate the FHBVC’s fuel expert’s prediction that it is possible for modern petrol to boil in the jet while the engine is running. The SU carburettor is a volumetric device, i.e. for a given volume of air entering the engine, it adds a fixed volume of petrol. When the petrol starts to boil, liquid and bubbles of vapour leave the jet which are less dense than just the liquid. As a result, a lower mass of petrol is delivered into the air stream resulting in a weak mixture.
Ed’s note: FHBVC = Federation of Historic British Vehicle Clubs.
Weak running further increases the engine’s temperature and under-bonnet temperatures, resulting in more fuel to boiling, until the mixture becomes so weak the engine splutters to a stop. This scenario is typical of stop-start driving in a queue of traffic.
There are two main ways the petrol in the carburettor can be heated, by radiation and convection from the hot exhaust manifold that sits just below the carburettors and by conduction through the inlet manifold from the cylinder head.
To measure the temperature of the petrol in the jet, sensors were fitted in the transfer pipe between the float chamber and jet of each carburettor (shown as xfer pipe on the graphs). Sensors were also fitted between the carburettors and inlet manifold, to measure the heat conducted from the engine, and to the inlet of each carburettor to measure the temperature of the inducted air.
The histograms which follow, show the range of measured temperatures for all the tests. The red area corresponds to the temperature range where petrol vaporisation would potentially cause problems.
While these do not reflect the temperatures that may be reached in an enclosed engine bay, they do show some interesting features.
The test engine was mounted on the dynamometer with no restrictions to air flow and, other than the exhaust manifold, with no hot areas near the carburettors. Unexpectedly, the temperature of the air entering the front carburettor was noticeably lower than that entering the rear carburettor (left hand graphs).
Rear Carburettor

Front Carburettor

This was possibly caused by air heated by the exhaust pipe which ran underneath the rear of the engine. These lower temperatures are also reflected in the manifold / carburettor temperatures (right hand graphs), showing that when the engine is running, the temperature or the inducted air is the main factor affecting the temperature of the carburettor body, rather than heat conduction through the inlet manifold.
This finding suggests that where possible, the air inlet to the carburettors should be positioned to induct as cool air as possible, perhaps even adding ducting to direct cold air to the carburettors.
The exceptionally high front manifold reading, shown in the red circle, corresponds to the half throttle tests, mentioned above where the mixture would have been very weak. The high manifold temperature of the front carburettor was the cause of this problem.
As only the front carburettor was affected and it is probable that when the engine had been stopped the inlet valve on either cylinders 1 or 2 was open. This allowed hot gasses into the inlet manifold raising the temperature of the front carburettor and causing the petrol to boil. This observation is consistent with the heat soak tests, reported in an earlier article, which showed heat from the inlet manifold was the main factor in increasing the temperature of the carburettors after the engine had been stopped.
When stopping a hot engine with the intention of restarting it a few minutes later (e.g. when filling up at a petrol station), it may be worth revving the engine and turning off the ignition while it was still revving. Keeping the throttle open as the engine runs down will allow cold air into the cylinders which may prevent this problem.
What is also significant is that the transfer pipe temperatures (middle graphs) were sufficiently high in some test runs to cause issues with vaporisation. However, other than the 5 weak running cases, highlighted above, weak running was not observed in any other tests. It is possible the fuel flow rate through the transfer pipe was sufficiently high that there was insufficient time for it to be heated before it reached the jet.
Furthermore, the temperatures in the front carburettor transfer pipe are noticeably higher than for the rear carburettor, demonstrating that, even in still air, there are measurable differences between the way heat is transferred from the exhaust manifold to the front and rear carburettors. While the reasons for this are not clear, it offers a possible explanation as to why some cars suffer from the hot restart problem and others do not.
Finally, there is an additional factor affecting this brand of 95 octane petrol, namely its volatility. Comparing the distillation curve for this fuel with that of a brand of super grade petrol shows the 95 octane petrol (blue line) is more volatile at typical under- bonnet temperatures.

At the 75oC to 80oC temperatures of the front carburettor, 45% of 95 octane fuel would have vaporized, compared with only 35% of the super grade fuel. This certainly would have made the weak running problem worse.
As the Manchester tests were run in March, it is possible this 95 octane petrol was “winter grade” which is why it was more volatile.
Slow combustion
Slow combustion is something David Heath and I postulated as a problem with modern petrol after running various tests using our TA and TC cars. Anomalies in the carburettor test data and other test data support this view. However, while I refer to the problem as “slow combustion”, modern petrol does not actually burn more slowly than classic petrol, this is an apparent effect caused by cyclic variability discussed in previous articles.
The four points in the blue circle, on the above graph, show the carburettors delivering different Lambda values for the same piston height. Simplistically, this is not possible as the volume of fuel is determined by the needle diameter at that piston height, i.e. same piston height, same volume of air, same volume of fuel, hence the Lambda values should be the same.
This effect can be seen more clearly on the data from all the test runs (below) in the region, highlighted by the blue oval. At piston heights between 0.3” to 0.4”, the full throttle tests (blue dots) consistently show a richer mixture than the half throttle tests (red dots).

The Suck, Squeeze, Bang and Blow article helps to understand this. The airflow through the carburettor is not constant, it is pulsed as each cylinder undergoes its “suck” cycle. With a single carburettor, there are two “sucks” per rev, and one “suck” per rev with a twin carburettor engine. The gasses in the inlet manifold and inertia of the suction piston normally act to smooth out this rapidly pulsing airflow, allowing the carburettor to function as expected. However, readers will remember “valve overlap” where the inlet valve starts to open in advance of top dead centre during the final phases of the exhaust stroke.
If the charge of fuel burned “slowly”, the pressure in the cylinder will be high when the inlet valve opens resulting in a pressure pulse entering the inlet manifold. This pressure pulse causes the suction piston to drop so that it is too low when the next induction cycle starts. This, in turn, causes the carburettor to deliver a richer mixture. The data clearly shows this effect for the full throttle tests below 3000rpm. Indeed, during some of the full throttle, lower rpm tests, the suction piston could be seen to be vibrating around a point rather than floating at a fixed height.
As engine revs increase so does the turbulence, improving mixing, which in turn reduces the magnitude of the cyclic variability and size of the back-pressure pulse. This is why the mixture can be seen to be returning to normal as piston height (engine revs) increases, ultimately, delivering the correct Lambda of around 0.95 above 3000 rpm, full throttle.
These tests support the “modern fuel burns more slowly” comment made by many classic car owners, however, this problem only occurs in the XPAG on high throttle settings below 3000rpm.
Supporting evidence for the slow combustion hypothesis comes from the other test runs with the same branded 95 octane fuel. In one set of test runs a nebulizer was fitted into the inlet manifold, in another set, 10% kerosene was added to the petrol. The graph below shows the full throttle data for these tests where each dot represents one test run.
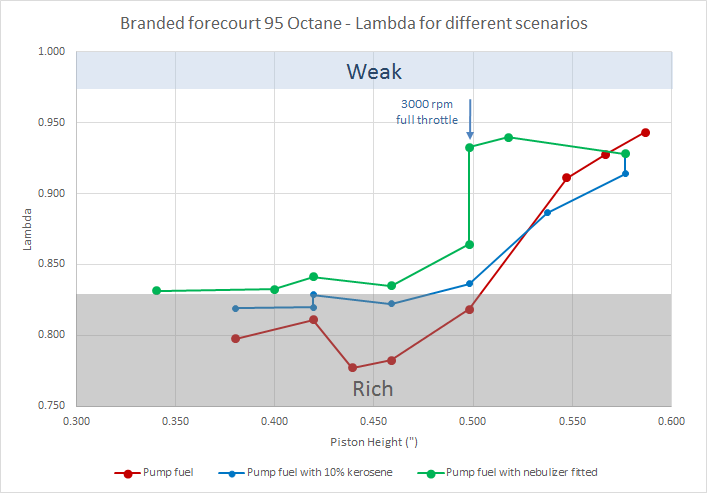
What can be seen is that, below 3000rpm, the enrichment caused by slow combustion is significantly reduced by the nebulizer (green line) and by the addition of kerosene (blue line) compared to the tests with the 95 octane petrol alone (red line).
The main effect of the nebulizer is to atomise the petrol and improve its dispersion before entering the engine, in much the same way as fuel injection systems. Better atomisation reduces cyclic variability, the number of late combustion cycles, the magnitude of the back-pressure pulses and their effect on the carburettor. Ultimately, reducing the enrichment of the mixture below 3000 rpm. The addition of kerosene appears to have a similar effect.
When I originally tested adding kerosene to petrol with my car on a rolling road, all present commented on how much smoother the engine sounded. This I attributed to a reduction in the magnitude of the cyclic variability, something now demonstrated by these tests.
Other evidence comes from the carbon monoxide emissions. In Suck, Squeeze, Bang and Blow, I described how high levels of carbon monoxide in the exhaust are an indicator of poor combustion. As the engine was fully re-tuned for every test, the levels of carbon monoxide are not an indicator of a poor state of tune and only reflect what is happening in the combustion process. High levels of carbon monoxide are the result of poor mixing where pockets of rich mixture do not burn properly. The graph below shows the carbon monoxide emissions for these same tests. On this graph the lower the levels of carbon monoxide, the better the engine is running.

Again, below 3000rpm, the results are striking. The test run with the 95 octane petrol (red line) produced almost twice the level of carbon monoxide as that produced by the tests run with the same fuel but with the nebulizer and added kerosene (green and blue lines). Interestingly, this data suggests the combustion is more complete with kerosene than with the improved mixing produced by the nebulizer. I do not have an explanation for this.
Above 3000 rpm full throttle, where slow burning does not appear to affect the engine, the nebulizer and addition of kerosene have a lesser effect.


As the engine was re-tuned for each test, the differences previously highlighted are not due to changes in mixture as is shown by the virtually identical values of Lambda and unburned hydrocarbon data for these tests (the two previous graphs). Hence, the differences in carbon monoxide can only be the result of changes in the combustion process.
The final supporting evidence comes from large reduction in exhaust temperatures as the ignition is advanced, reported in an earlier article. Advancing the ignition timing reduces the number of cycles that occur late and the volume of fuel burning in the exhaust.

Although there is no data covering throttle settings between half open and fully open, it can be assumed that as the throttle is opened the magnitude of this slow combustion problem will increase until it reaches the level shown by the full throttle tests.
The negative effects of slow combustion are to increase exhaust, cylinder head, exhaust manifold temperatures and ultimately the under bonnet temperature; all factors which contribute to the hot restart problem. Additionally, hot inlet and exhaust valves can cause pre-ignition or pinking seen in some engines. Unfortunately, slow combustion occurs in the rev range between 1750 to 3000 rpm at part to full throttle, conditions typical of normal road driving.
Conclusion
This data from the Manchester XPAG tests clearly demonstrates two problems with modern fuel that ultimately lead to the hot restart and “overheating” problems that many classic owners suffer from.
The transfer pipe temperature graphs show that the petrol in the carburettor can become sufficiently hot that modern petrol, which vaporises at lower temperatures than classic petrol, is susceptible to boiling – the cause of the weak running effect. Operating “so close to the edge” means that even a small temperature increase can have a disastrous effect, for example, when driving in slow moving traffic.
When an engine stops, the tests also show that hot gasses leaking back into the carburettors from open inlet valves can make matters worse and are probably a significant factor that contribute to the hot restart problem.
The second problem, slow combustion, compounds matters, particularly at normal road driving speeds, by increasing cylinder head and exhaust temperatures and ultimately the under-bonnet temperatures.
But all is not doom and gloom, the tests have also suggested ways in which these problems can be mitigated. Wait for the next article!
Paul Ireland
Have you seen this interesting videos series ?
https://www.youtube.com/watch?v=jdW1t8r8qYc
The guy made a transparent cylinder head for a side valve engine, filming it with a high speed camera.
He tries several fuels and one can clearly see the effect of slow burning, advance, mixture…
Perhaps could help. But building such a transparent head for a OHV is much more tricky. Maybe a window only ?
Laurent.